UK Gilts, Yield and Taxation
Shouldn't I just invest everything in the S&P?
Stocks and Bonds
The S&P and FTSE
In 2023 and 2024, the US stock market (S&P 5001) performed remarkably well, netting over 23% gains in both years with another 2-3% of dividends on top. 2025 looks like another 18-20% gain is likely. However, these gains have not been linear; this year between January and April we saw a drop of 15% before recovering.
Elsewhere, performance of the FTSE2 has shown similar variability; flat in 2022 with small gains of 3-4% in 2023 and 2024 before 2025’s run of around 18%, excluding dividends.
The risk following years of high returns is that valuations become stretched and that a reversion back to the mean becomes more likely. An investor concerned about this might therefore ask themselves about their alternatives. One of those alternative choices are bonds; individually or as an index.
Bonds
By comparison to stocks, bond funds, e.g. Vanguard UK Govt Bonds3, look like they perform significantly less well than stocks.
Why then would anyone invest in bonds?
The key advantage to bonds is guaranteed return of principal. Sovereign debt issuers such as the UK or the US are very unlikely to default on the bond terms. Consequently, although the cost of borrowing for a government may vary and this can affect the current price of the bond during its life, e.g. leading to a poor return in one year, as a bond gets closer to maturity its price will almost inevitably converge to 1. Consequently government debt can be thought of as paying a very predictable coupon stream that may be ideal for providing an investor with a virtually guaranteed income along with return of the invested capital.
Assuming that the investor does not need to invest all their capital to receive a liveable income that can free them up to take more risk with the remainder. It can also be a good place in which to park money to reduce exposure to stock markets following a period of sustained gains where a crash is deemed to become more likely.
Separately, depending on nationality and tax residency there can be advantages to gilts for taxation. Bonds pay the investor with a coupon, analogous to a stock dividend, and with return of capital at a fixed point. These payments are often taxed differently by governments; coupons often being taxed as income and principal as either capital gains or received tax free. Where top rates of income tax can reach 45% in the UK the difference between receiving a dividend or coupon that incur income tax and a principal gain can be considerable; a 5% before tax coupon or dividend looking more like 2.5% after tax.
When comparing bonds, the prices alone are not sufficient. In the next section we’re going to look at getting loading the bond static data and market data in order to do so.
Bond Analytics: Accrued Interest, Prices, Yield and Taxation
In pricing and analysing bonds, to compare two bonds, simply comparing the raw prices isn’t sufficiently useful. A bond which pays a much larger coupon than another, all other things being equal, should have a higher value.
All other things, however, are rarely equal, here’s where Relate can help. We enable you to calculate standard metrics that allow for comparison to each other and to key stock metrics. Analysing these metrics is also required in order to know what the effective tax rate on two different bonds is in the case of capital gains tax relief on Gilts.
Below we examine UK Government bonds (Gilts) pricing using Relate. The Relate software, running on your machine can be accessed via Python, Excel, or GUI, in all cases the compute engine and available data are the same. The examples below are all screenshots showing Relate being accessed via a Jupyter Notebook.
Load Bond Instrument Definition
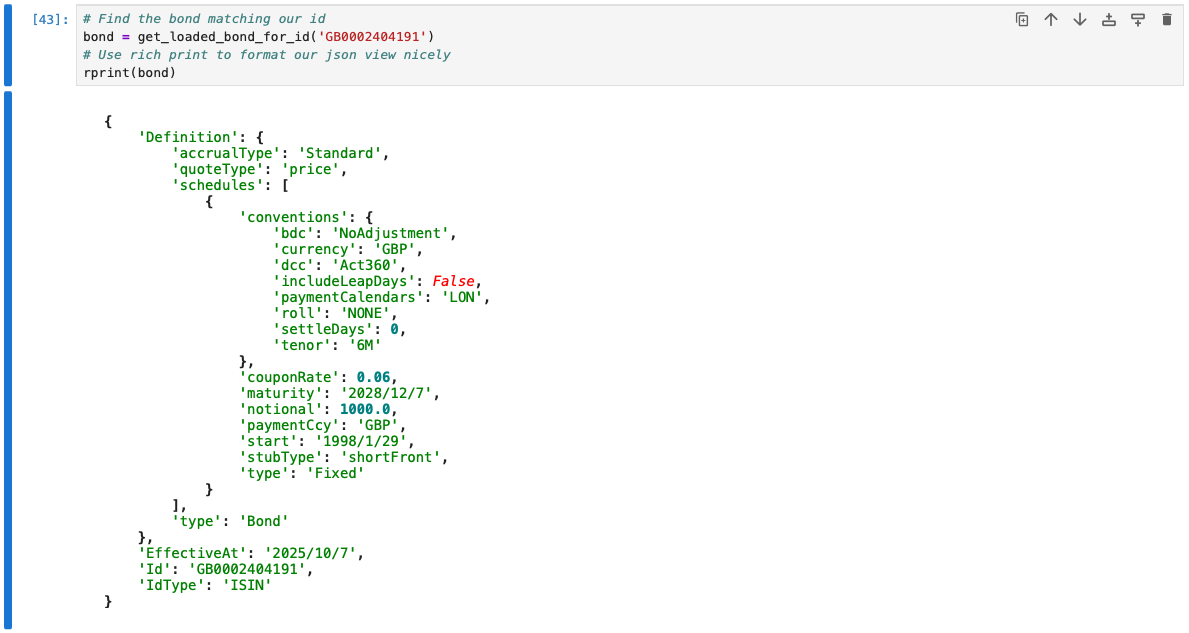
Here we can see a bond representation, Relate holds a full bond representation including maturity , coupon amounts and payment frequencies.4 From these we generate the bond payment schedules and cash flows. This bond was created from the bond definition as provided by the Debt Management Office. 5
| ISIN | Maturity | Coupon Rate | Coupon Type | Frequency | Currency |
|---|---|---|---|---|---|
| GB0002404191 | 2028/12/7 | 6% | Fixed | 6M | GBP |
Create a portfolio
We can then place our bonds into the portfolio, by adding some simple transactions. For the sake of simplicity we are only going to consider the case where we are following a simple buy and hold strategy and have a portfolio containing a single holding each of two Gilts, both with fixed coupons.
| ISIN | Quanity |
|---|---|
| GB0002404191 | 1 |
| GB00BFX0ZL78 | 1 |
Market Data
To price a bond, market data is required. A discount curve for calculating the present value of future cashflows for UK Gilts and the inflation index data for the RPI indexed Gilts.
Here we are going to focus on fixed rates bonds. We are going to the Bank of England6 for our data, Relate can consume and translate the curve data provided by the Bank (among others) to use in pricing.
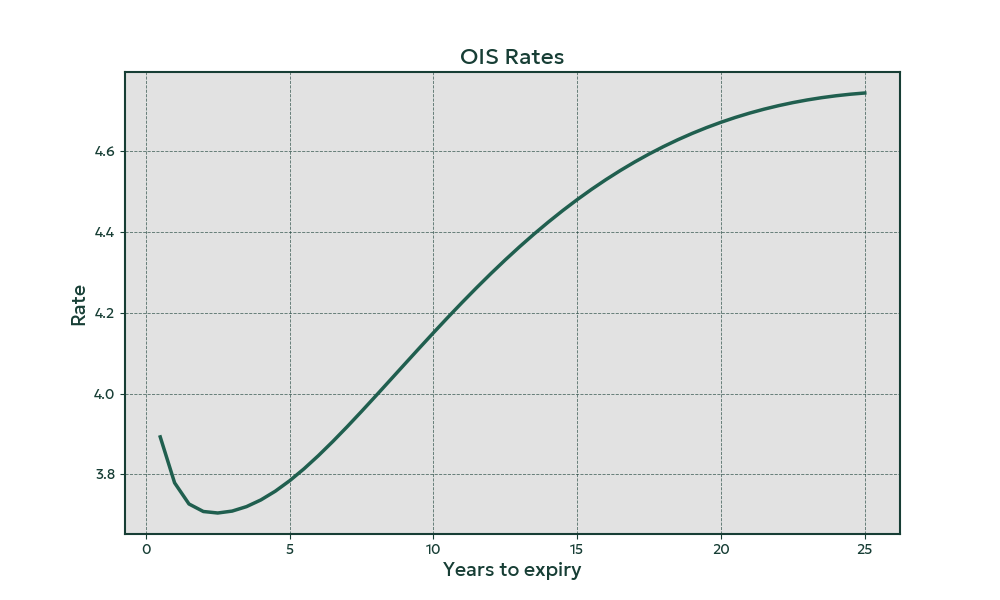
Below we have the curve that has been loaded. We can see as the curve slopes upwards towards the longer end; this is typical as investors require a higher yield to lock their money up for a longer period of time. The dip at the short end of the curve reflects the prevailing market sentiment that the Bank of England will cut rates over the next few months.
Price and Metrics
Pricing
Now that we have loaded the instruments, the portfolio, and the market data, we can price our portfolio, as well as view relevant metrics, like yield to maturity and the clean price of the bond (this is useful when tracking the bond valuation over time to remove jumps that arise when coupons are paid).
| ISIN | Accrued | Clean Price | Dirty Price | Present Value | Yield to Maturity |
|---|---|---|---|---|---|
| GB0002404191 | 20 | 1.07068 | 1.09068 | 1090.68 | 3.6746% |
| GB00BFX0ZL78 | 7.46 | 0.94136 | 0.94882 | 948.82 | 3.6729% |
Cashflows
As well as these single point computations relating to the price of the bond, Relate also allows users to compute and retrieve rich tabular data such as cashflows showing all of the future coupon amounts to be paid over the remaining life of each bond in the portfolio, for the above portfolio we get:
| ISIN | Type | Payment Date | Amount | Currency |
|---|---|---|---|---|
| GB0002404191 | Coupon | 2025-12-07 | 30 | GBP |
| GB0002404191 | Coupon | 2026-06-07 | 30 | GBP |
| GB0002404191 | Coupon | 2026-12-07 | 30 | GBP |
| GB0002404191 | Coupon | 2027-06-07 | 30 | GBP |
| GB0002404191 | Coupon | 2027-12-07 | 30 | GBP |
| GB0002404191 | Coupon | 2028-06-07 | 30 | GBP |
| GB0002404191 | Coupon | 2028-12-07 | 30 | GBP |
| GB0002404191 | Principal | 2028-12-07 | 1000 | GBP |
| GB00BFX0ZL78 | Coupon | 2025-10-22 | 8.125 | GBP |
| GB00BFX0ZL78 | Coupon | 2026-04-22 | 8.125 | GBP |
| GB00BFX0ZL78 | Coupon | 2026-10-22 | 8.125 | GBP |
| GB00BFX0ZL78 | Coupon | 2027-04-22 | 8.125 | GBP |
| GB00BFX0ZL78 | Coupon | 2027-10-22 | 8.125 | GBP |
| GB00BFX0ZL78 | Coupon | 2028-04-22 | 8.125 | GBP |
| GB00BFX0ZL78 | Coupon | 2028-10-22 | 8.125 | GBP |
| GB00BFX0ZL78 | Principal | 2028-10-22 | 1000 | GBP |
Tax Adjusted Yield
As we can see from both the cashflows our first bond - GB0002404191 - pays a much higher coupon than the second. From an individual investor’s perspective, this means that there will be more tax to pay, as these coupon payments are not tax exempt for gilts. This can also be observed in the price, we can see that this bond is priced above par, compared to GB00BFX0ZL78 which has a price below par, allowing for capital gains to be made as the price converges to 1 at expiry. Here we can see the impact for a higher rate tax payer.
We can request the Tax Adjusted Yield to Maturity from Relate, showing the exact increase in realised after tax earnings that can be achieved by buying GB0002404191 rather than GB00BFX0ZL78.
| ISIN | Yield to Maturity | Yield to Maturity (tax adjusted) |
|---|---|---|
| GB0002404191 | 3.67% | 3.36% |
| GB00BFX0ZL78 | 3.67% | 2.80% |
Conclusion
We have seen how Relate can be used to analyse UK government bonds for yield and tax-adjusted yield.
Whilst bonds often have a lower total return than stocks, their principal preserving and tax advantaged features can be useful in a mixed portfolio.
In future blogs we will look at:
- using Excel, Jupyter Notebook/Python, and Relate’s UI to perform easy data manipulation and analysis
- analysing data series for stocks and bonds in Relate
- examining likely bond behaviour in turbulent markets by perturbing of market data
- https://www.spglobal.com/spdji/en/indices/equity/sp-500/#overview↩
- https://www.londonstockexchange.com/indices/ftse-100↩
- https://www.hl.co.uk/funds/fund-discounts,-prices—and—factsheets/search-results/v/vanguard-uk-government-bond-index-accumulation↩
- The full bond representation in relate when flattened to a JSON representation looks as follows:
 ↩
↩ - Details on all Gilts currently in issue can be found at: https://www.dmo.gov.uk/data/↩
- Estimated yield curves are published by the Bank of England daily, and can be found at: https://www.bankofengland.co.uk/statistics/details/further-details-about-yields-data↩