Exploring Portfolios Analytics in the Relate UI
A first look at using Relate to explore bond and equity pricing and cashflows
Relate
A key goal in building Relate was to create a single tool that allows for a unified way of interacting with disparate and diverse sources of data. In doing so a natural proving ground for us is financial data; having worked on bond and equity pricing and market data for many years. Financial markets are a great source of large quantities of data in multiple forms, from the highly structured, like quotes on an exchange, semi structured such as the PDF of a bond issuance, to the unstructured, a news article about an upcoming Bank of England Monetary Policy Committee meeting.
In order to make use of this data we are building a financial data platform that allows for the loading, normalisation and transformation of this data, as well pricing and analysis tools. These will all be available via both API and GUI, today we’re going to take a look at GUI, and some of the data that we have available, and what tools we have built for analysis.
Bond pricing and analysis
We can search over and generate pricing for a wide range of bonds, currently we have all currently issued gilts, as well as a range of treasuries, and are increasing coverage of corporate bonds.
For individual bonds, we can compute the price, given the loaded curves, as well as both the historic an future cashflows, as well as standard bond computations, such as duration, convexity and yield to maturity.
Equity pricing and analysis
Similar to bonds, for equities we can compute prices as well as display the fundamentals, initially with a particular focus on US listed stocks. Stocks can be searched for via exchange, ticker or company name.
Our stock screen gives a wide range of information, price and volume history, company financials, dividend history, as well as any regulatory filings for the stock.
Holdings Portfolios
We can create portfolios to represent a hypothetical selection of stocks bonds as a holdings portfolio and value all of these simultaneously. In our initial release we’re focussing on the comparatively simple world of holdings portfolios, for analysis/decision making purposes, rather than also taking on the complexity of a full portfolio management system approach, that is a large project, and warrants a dedicated approach in a later version.
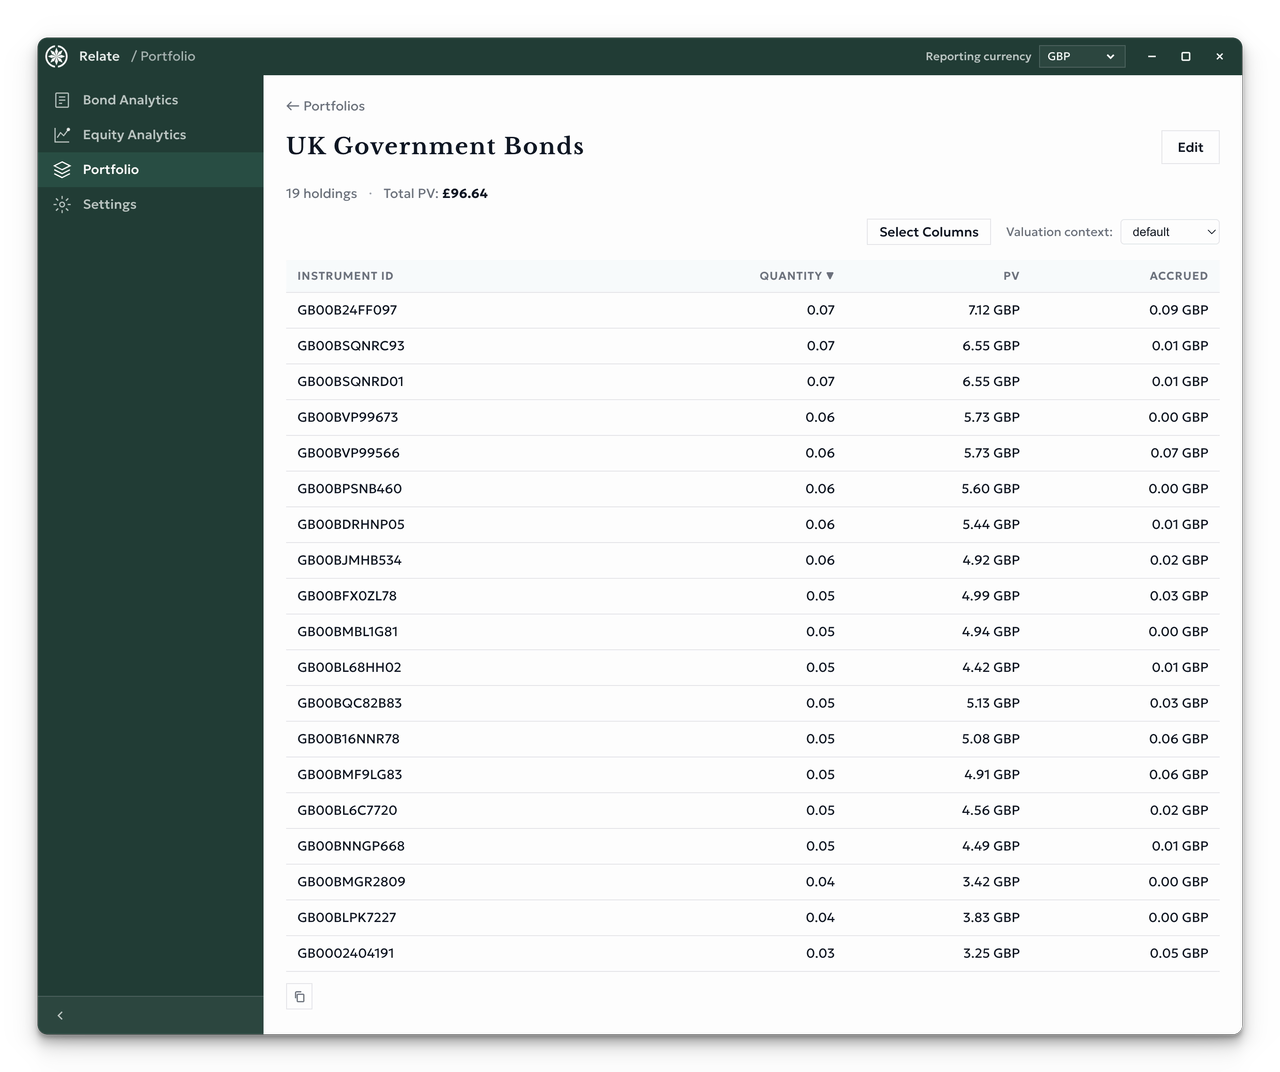
Below we can see a portfolio with a selection of UK government bonds1 and prices, using the interest rate curve sourced from the Bank of England, as well as the accrued interest for each bond.
Magnificent 7 Portfolio
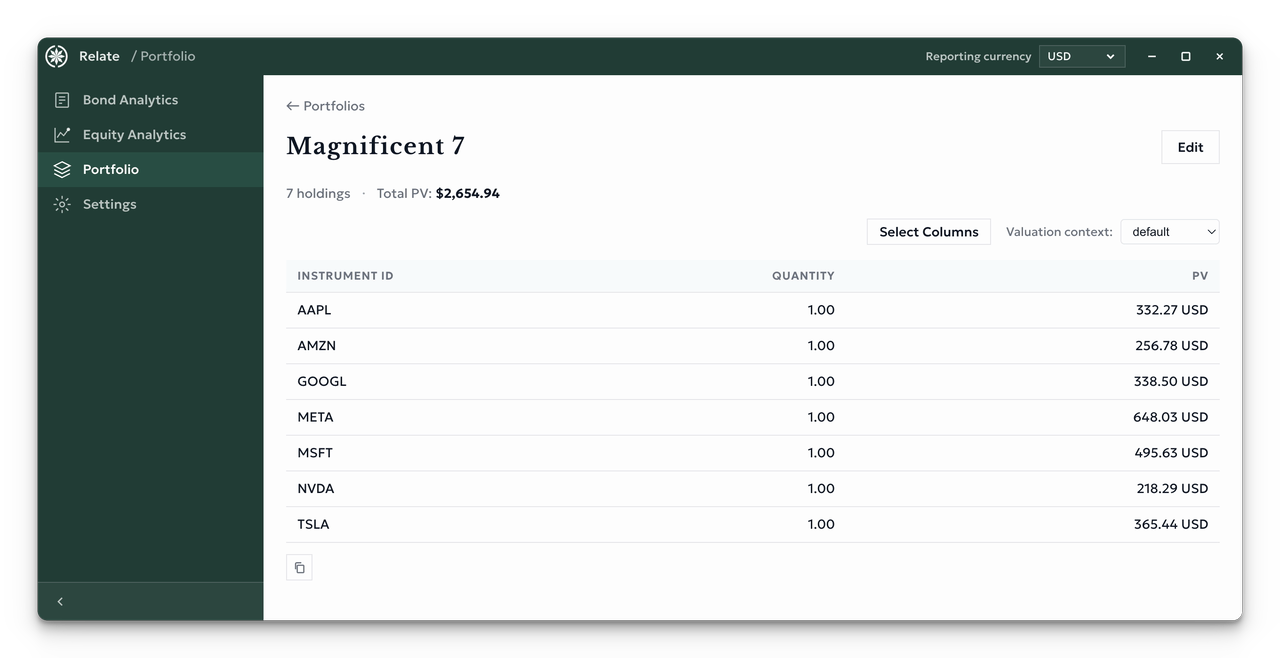
In order to look at an equities portfolio, we’re going to have a look at a small portfolio consisting of the magnificent seven, and value that using our market data.
Mixed Portfolios
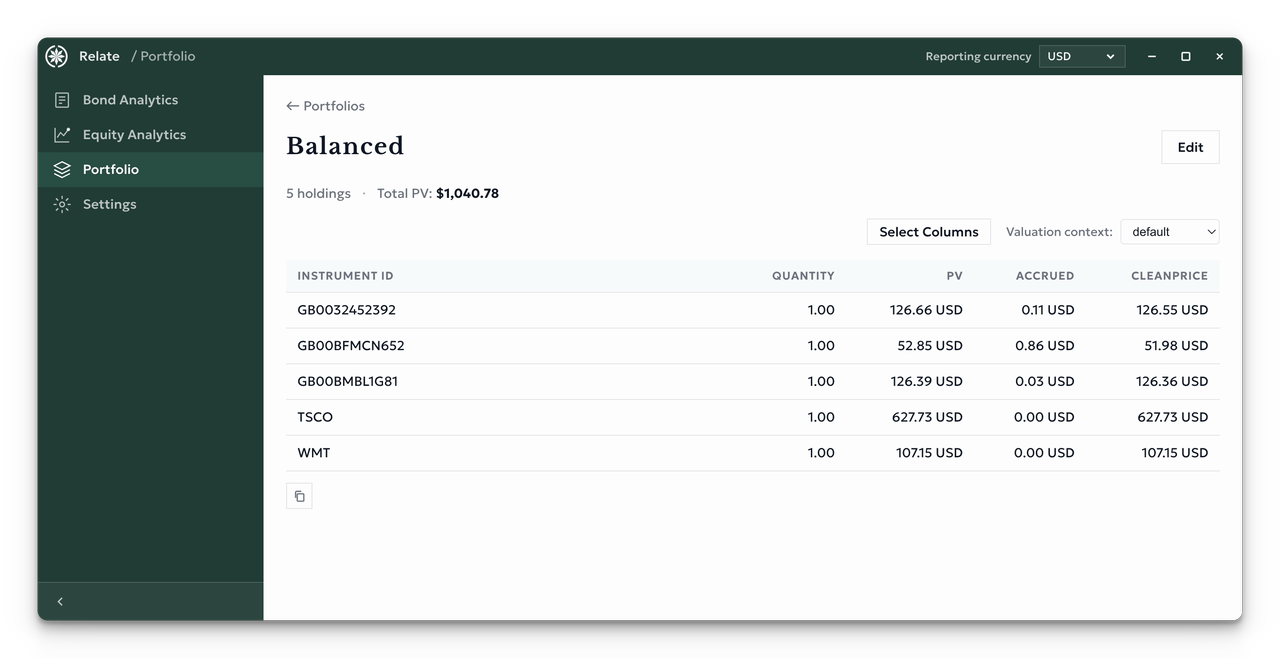
The above examples show examples of portfolios that are inspired by indices and focus on one asset class, and in one currency, the real world isn’t quite as neat, and our portfolio analytics will compute pricing and analytics of portfolios with mixed instrument types, as well as apply the appropriate FX rate.
Feeds/Data sources
We currently source data and feeds from a number of different providers and normalise to a standard form on the way in. This allows us to make use of multiple data sources in a consistent fashion, as well as having a structured process for onboarding new data sources; that can be summarised as provide a source of data, and a mapping or translation from the data objects that the source can provide to a known format that can be used in our analytics, or without in the case of data that will be passed through, but not directly used by our system.
Data provenance is the other side of this coin, as part of the loading of data, we also track where that data has come from. This means when a particular quote or curve is used in an analytics calculation, we can trace it back to its source, either in order to investigate discrepancies, to assist with audit purposes, and to provide proof of data usage according to licence agreements. This can be particular useful in cases where data might be using a mix of sources to build something like a curve.
API
We have been looking at the functionality that the Relate UI can provide, for ease of interaction. This functionality is build on top of our Relate API, which will allow customers to make any of the same calls, over a REST api from their toolchain of choice, this allows for easy extensibility in the case that there are some extra calculations or visualisations that you wish to on top, or in order to output the Relate data into another system, output reports, trigger actions.
- This is a replicating portfolio approximating the iShares UK Gilts 0-5yr UCITS ETF↩